“Hurricane Irma churned across the Atlantic Ocean in September 2017, battering several Caribbean islands before moving on to the Florida Keys and the U.S. mainland. As the clouds cleared over places like the Virgin Islands, the destruction became obvious even from space.”
Satellite Photographs of Caribbean Islands Before and After Hurricane Irma
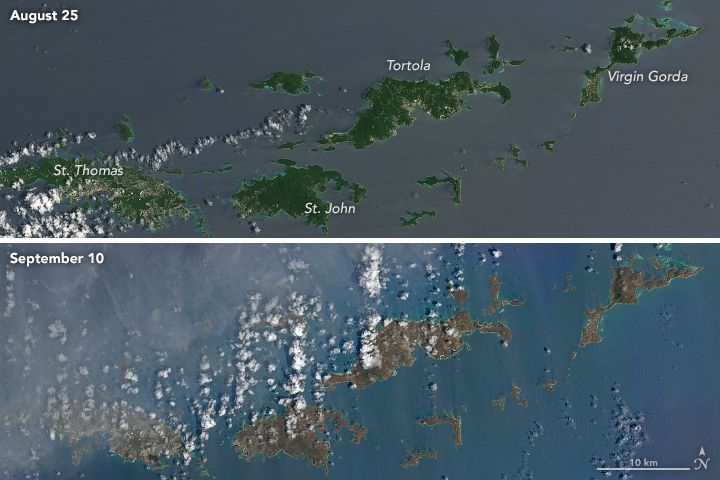
That opening paragraph is from this article which was written by Kathryn Hansen for NASA Earth Observatory pertaining to color images of islands in the northern Caribbean Sea — that were as free of clouds as possible — which Joshua Stevens searched using Landsat data from the United States Geological Survey. He compiled them with limited graphics for the purpose of comparing the ones taken in August and September of 2017 — respectively before and after Hurricane Irma impacted upon the islands.
The images were captured by the Operational Land Imager on the Landsat 8 satellite; and they show how much of the topography was lush and green prior to the arrival of Hurricane Irma — and how much became brown after the powerful Category 5 hurricane with maximum sustained winds of 185 miles per hour stripped away much of the vegetation.

Hurricane Irma passed the northernmost Virgin Islands on the afternoon of Wednesday, September 6, 2017. Notice how the islands are mostly green in color in the image taken on Friday, August 25, 2017 prior to the arrival of the hurricane — and how brown they became on Sunday, September 10, 2017 after they were devastated by the storm.

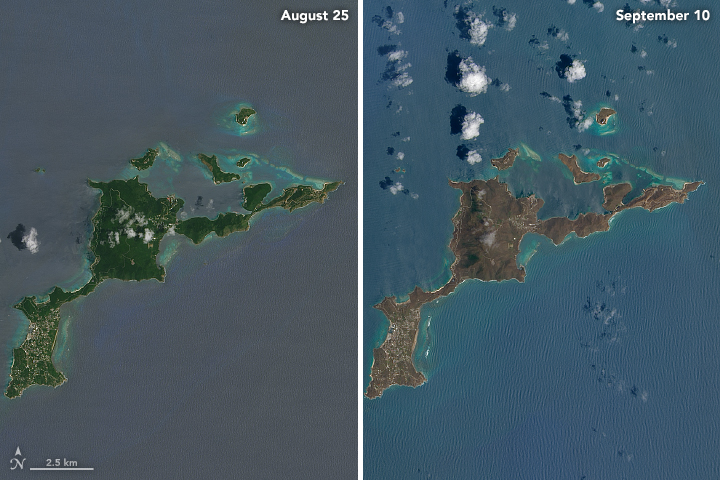
Upon viewing an enlargement of Virgin Gorda, notice how some of the vegetation on the southern and western portions of the island is a bit greener. This is “likely because it was partly shielded from winds by the hills in the center”, according to the aforementioned article. “Differences in ocean color likely stem from differences in the ocean surface; rougher surfaces scatter more light, and appear brighter and lighter.”

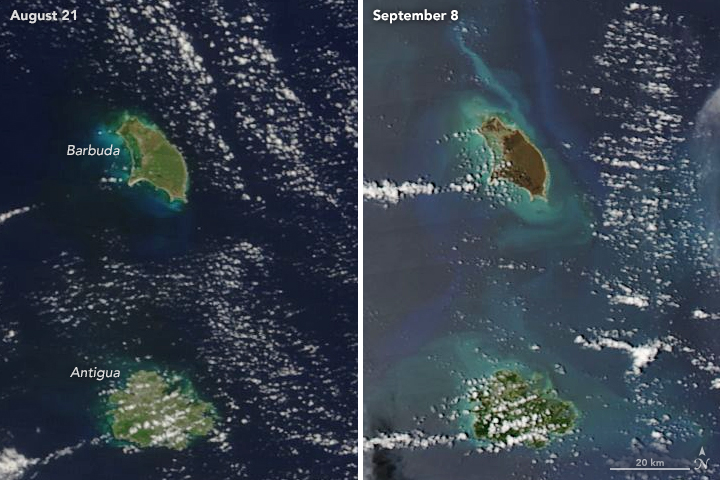
The destruction is also clearly visible on the small island of Barbuda, on which the eye of the storm hit directly and either damaged or destroyed greater than 90 percent of the structures on the island. The photograph on the left shows the lush tropical island on Monday, August 21, 2017; while the photograph on the right shows Barbuda after Hurricane Irma lashed its fury and power on it on Friday, September 8, 2017…
…and yet, Antigua appears relatively almost untouched. While the people of Barbuda are still coming to terms with the vast destruction of their island and are a long way from recovery, electricity has been restored to most of Antigua; and Vere Cornwall Bird International Airport is back in operation.
These images were acquired by the Moderate Resolution Imaging Spectroradiometer on the Terra and Aqua satellites of the National Aeronautics and Space Administration of the United States — which is more popularly known as NASA.
Summary
That the differences between the images can be seen from space is amazing — and the cause was one of the most powerful hurricanes ever recorded in the Atlantic basin.
By writing this article, I may have inadvertently found a new cool “toy” with which to play: Landsat data from the United States Geological Survey, with which you can enter criteria to search for specific places on our planet — even down to the precise location of the residence in which you live — and compare various images and data from different times and dates, as was done by Joshua Stevens with the photographs in this article…
…or if you prefer a tool which is even easier to use, try out the Historical Topographic Map Explorer from the United States Geological Survey.
Another cool tool which you can use is to watch a time lapse of virtually anywhere in the world between the years 1984 through 2012, with which I used to show photographs of Biloxi and part of the Mississippi Gulf Coast before and after the landfall of Hurricane Katrina in 2005. The tool — which is the result of a collaboration between Time magazine and Google — has since been expanded to include the years up to 2016. I wish that I could zoom in closer in many cases, which is one of my few criticisms about this tool; and only one satellite view per year can be used in the comparison, which would be otherwise useless for this article…
…and Google Earth has its own version of the tool without the collaboration with Time magazine.
Source: United States Geological Survey, with image composition and graphics by Joshua Stevens.
