
A new National Hurricane Center cone debuts 2024 from the National Oceanic and Atmospheric Administration of the United States, which strives to be more accurate about what a tropical weather system is doing for inland areas that are not located along a coastline. The debut officially occurred on Thursday, August 15, 2024; and the new graphic could help improve your being prepared in case tropical systems affect your travels.
New National Hurricane Center Cone Debuts 2024
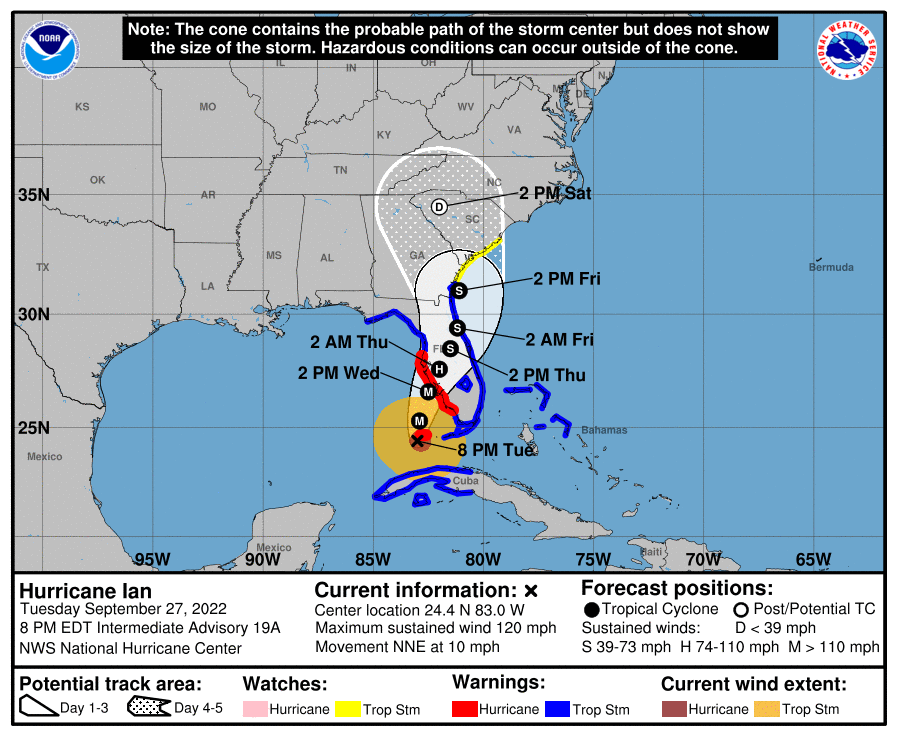
When Hurricane Ian was active in the Gulf of Mexico on Tuesday, September 27, 2022, the graphic shown above was used in an article here at The Gate With Brian Cohen to alert you of airlines which issued travel waivers — but also to let you know what watches and warnings were officially issued by the National Hurricane Center.
Unfortunately, the graphic was not completely accurate because the watches and warnings only covered coastal areas. Despite the track of the eye of Hurricane Ian being forecast to move directly over Orlando, no indication of any watches or warnings are shown in the graphic for Orlando — even though the city would expect to experience hurricane conditions.

The new experimental cone better depicts the watches and warnings inland as well as along the coast. In this example, Orlando is shown to be under a hurricane warning.
According to this article from Inside the Eye, which is the official weblog of the National Hurricane Center:
- The current operational version of the cone graphic only shows tropical storm and hurricane watches and warnings in a line along portions of the coast that may be affected. The experimental version will add a depiction of these watches and warnings for inland areas in the continental United States, in addition to those in effect along the coast.
- Watches and warnings in effect for land areas will take visual precedence over the cone in the experimental version. This is because tropical storm and hurricane watches and warnings actually convey the risk of strong winds from a tropical cyclone and should be the primary information used by decision makers to assess their wind risk before a storm. The cone itself does not convey the risk of strong winds, and only looking at that component of the graphic can be misleading.
- The current cone graphic shows white transparent shading to depict the forecast track uncertainty for the first 3 days of the forecast, and then white stippling for the 4- and 5-day portion of the forecast. Since there isn’t really anything special between the early and latter parts of the forecast, the experimental version will instead use white transparent shading with a solid white outline for the entire forecast cone.
This cone is called “experimental” because several items still need to be worked out before it becomes the default standard, which are explained in detail in the aforementioned article.
Final Boarding Call
I have always been fascinated by meteorology and weather. I enjoy sharing my fascination with you because you can benefit from avoiding hassles related to travel that are caused by weather. I also try to explain in simple terms with each weather article how and why the weather does what it does so that you can better understand not only what is happening; but also what to expect.
Use of the new experimental graphics are being considered for use here.
I hope that the articles I write pertaining to weather are helpful to you in your travels. If you have any questions about weather, please ask them in the Comments section below.
Source: National Hurricane Center of the National Oceanic and Atmospheric Administration of the United States.
