The Department of Transportation of the United States released its Air Travel Consumer Report for August of 2022, which pertains to airline operational data that was compiled for the month of June and for the second quarter of 2022 for on-time performance, consumer complaints received, mishandled baggage, and mishandled wheelchairs and scooters…
Consumer Complaints Of Air Travel Increased By Nearly 270 Percent

…and the report revealed an increase of complaints in air travel service of:
- 34.9 percent from 4,344 complaints in May 2022 to 5,862 complaints in June 2022
- 269.6 percent from 1,586 complaints received in June 2019 prior to the current 2019 Novel Coronavirus pandemic
- 27.8 percent from 22,336 complaints received during the first six months of 2021 — and more than the entire year of 2019
Of those 5,862 complaints received in June 2022:
- 3,382 complaints — or 57.7 percent — were against air carriers based in the United States
- 2,020 complaints — or 34.5 percent — were against air carriers based outside of the United States
- 460 complaints — or 7.8 percent — were against travel companies
Also, of those 5,862 complaints received in June 2022:
- 1,686 complaints — or 28.8 percent — pertained to cancellations, delays, or other problems or deviations with flights from the schedules of airlines.
- 1,435 complaints — or 24.5 percent — pertained to refunds. Many passengers who were initially denied refunds have since received the required refunds. The Office of Aviation Consumer Protection of the Department of Transportation of the United States recently concluded its investigation of ten airlines; and is pursuing enforcement action against them for extreme delays in providing refunds for flights the airlines canceled or significantly changed — as well as also actively investigating the refund practices of additional airlines flying to, from, or within the United States.
The 583,584 flights which operated in June 2022 were 85.8 percent of the 679,802 flights operated in June 2019. Operated flights in June 2022 increased by 3.4 percent year-over-year from the 564,583 flights which operated in June 2021; and down 1.3 percent month-over-month from the 590,957 flights which operated in May 2022.
18,473 flights — or almost 3.07 percent of the 602,057 flights which were scheduled in June 2022 by the ten marketing network carriers — were canceled.
Numbers from 2019 are meant to show statistics prior to the current 2019 Novel Coronavirus pandemic.
On-Time Arrival in June 2022

Reporting marketing carriers posted an on-time arrival rate of 73.5 percent, which decreased from 77.2 percent in May 2022 and increased from 73.3 percent in June 2019. The year-to-date on-time arrival rate for 2022 is 75.9 percent.
Highest Marketing Carrier On-Time Arrival Rates
- Alaska Airlines Network — 78.7 percent
- Delta Air Lines Network — 78.4 percent
- Hawaiian Airlines — 77.2 percent
Lowest Marketing Carrier On-Time Arrival Rates
- Allegiant Air — 59.0 percent
- JetBlue Airways — 61.3 percent
- Frontier Airlines — 69.5 percent
For the first six months of 2022, the reporting marketing carriers posted an on-time arrival rate of 75.94 percent, which decreased from 77.41 percent for the same period in 2019.
Flight Cancellations in June 2022

Reporting marketing carriers canceled 3.1 percent of their scheduled domestic flights, which is higher than the rate of both 1.6 percent in June 2021 and 2.1 percent in June 2019.
Lowest Marketing Carrier Rates of Canceled Flights
- Hawaiian Airlines — 0.1 percent
- Alaska Airlines Network — 0.7 percent
- Frontier Airlines — 1.1 percent
Highest Marketing Carrier Rates of Canceled Flights
- American Airlines Network – 4.4 percent
- Delta Air Lines Network – 3.9 percent
- United Airlines Network – 3.5 percent
For the first six months of 2022, the reporting marketing carriers posted a cancellation rate of 3.2 percent, which increased from 2.4 percent for the same period in 2019.
Other Statistics For June 2022

In other statistics for June 2022:
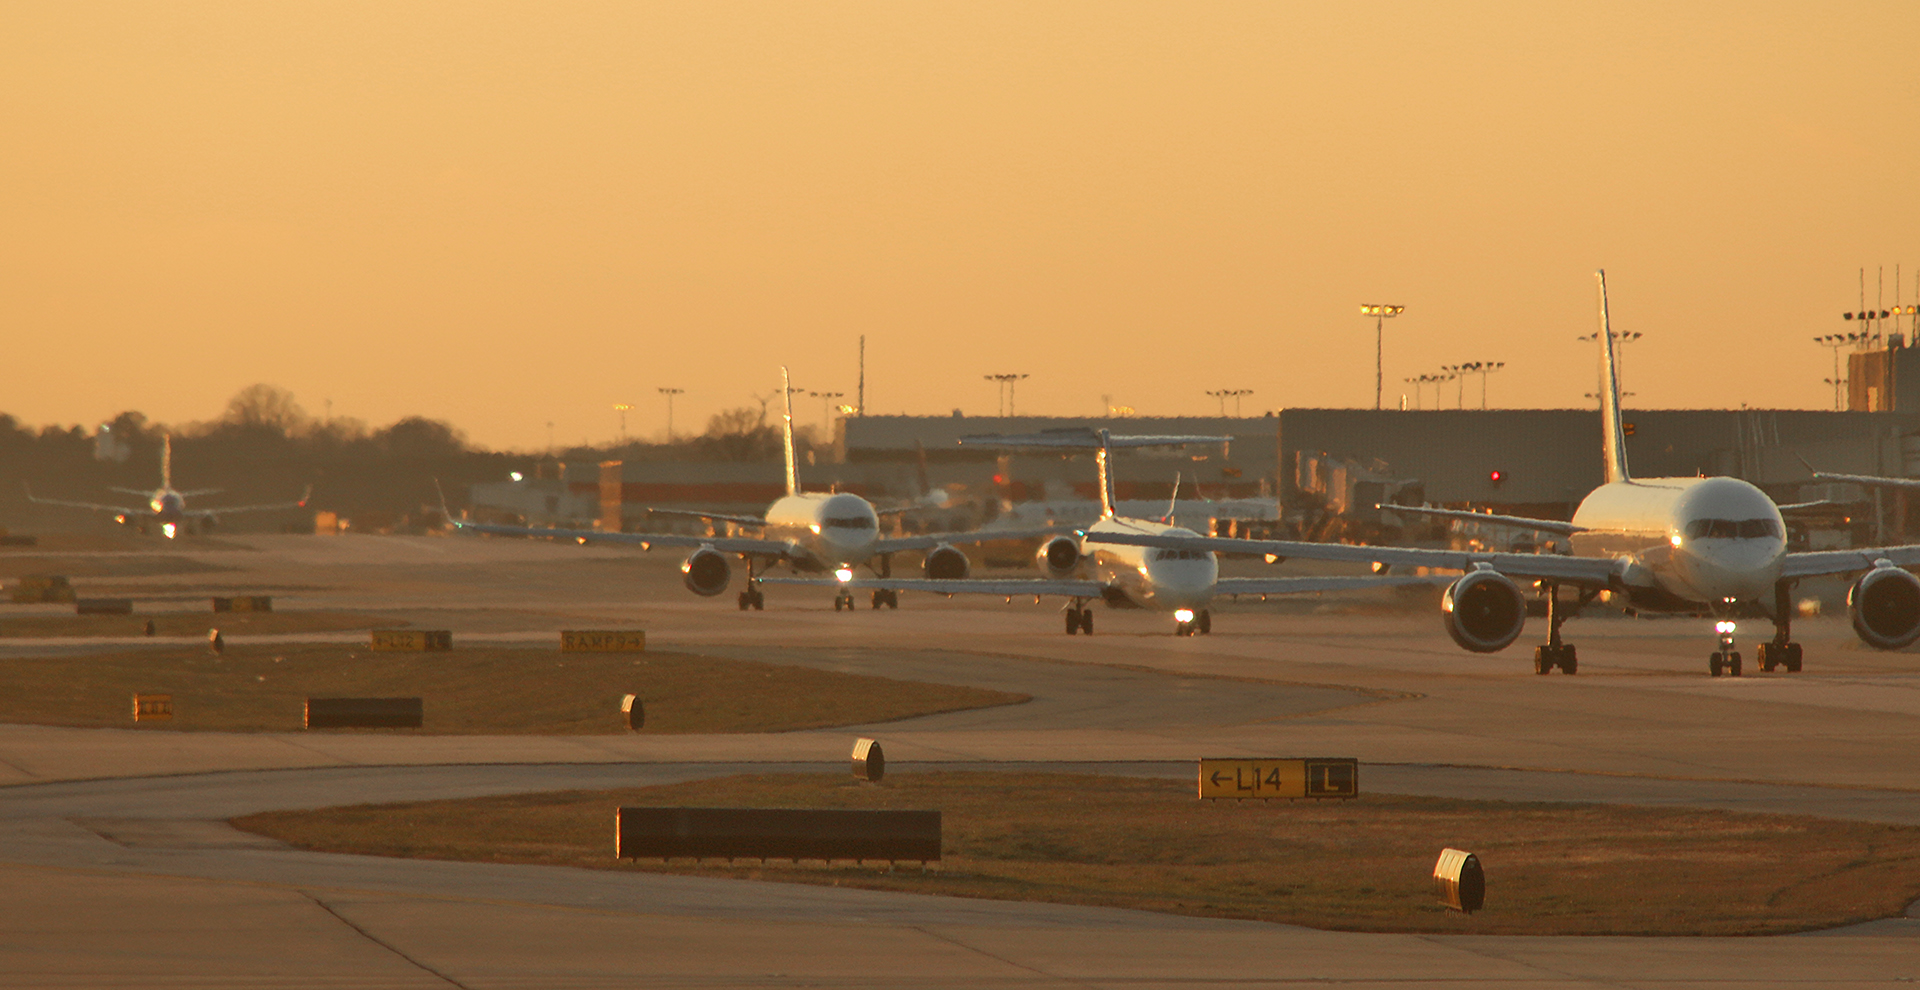
- Delays on the apron or runway: Airlines reported 60 tarmac delays of greater than three hours on domestic flights, as compared to 65 tarmac delays reported in May 2022 and 48 tarmac delays reported in June 2019. In June 2022, airlines reported zero tarmac delays of greater than four hours on international flights, compared to two tarmac delays reported in May 2022 and two tarmac delays reported in June 2019. Airlines are required to have and adhere to assurances that they will not allow aircraft to remain on the tarmac for more than three hours for domestic flights and four hours for international flights without providing passengers the option to deplane, subject to exceptions related to safety, security, and Air Traffic Control related reasons. An exception also exists for departure delays if the airline begins to return the aircraft to a suitable disembarkation point to deplane passengers by those times.
- Mishandled baggage: Reporting marketing carriers handled 43 million bags and posted a mishandled baggage rate of 0.71 percent, which is a higher rate for the May 2022 rate of 0.56 percent and equal to the June 2019 rate of 0.71 percent. For the second quarter of 2022, the carriers posted a mishandled baggage rate of 0.63 percent, which is higher than the second quarter 2019 rate of 0.61 percent.
- Mishandled wheelchairs and scooters: Reporting marketing carriers reported checking 68,229 wheelchairs and scooters and mishandling 1,145 for a rate of 1.68 percent mishandled wheelchairs and scooters, which is higher than the rate of 1.53 percent mishandled in May 2022 and the rate of 1.54 percent mishandled in June 2019. For the second quarter of 2022, the carriers posted a mishandled wheelchair and scooter rate of 1.52 percent, which is lower than the second quarter 2019 rate of 1.62 percent.
- “Bumping” and oversales: For the second quarter of 2022, the ten reporting marketing carriers which are based in the United States posted an involuntary denied boarding, or bumping, rate of 0.36 per 10,000 passengers, which is higher than the rate of 0.17 in the second quarter of 2021 and the rate of 0.31 in the second quarter of 2019. This data is reported quarterly rather than monthly.
- Incidents involving animals: Carriers reported one incident involving the death, injury, or loss of an animal while traveling by air — in this one case, the animal died — which increased from the zero reports filed in May 2022, but decreased from the two reports filed in pre-pandemic June 2019.
- Complaints About Treatment of Disabled Passengers: A total of 177 complaints related to disability were received — which increased from both the 158 complaints related to disability which were received in May 2022 and the 70 complaints related to disability which were received in June 2019. For the first six months of 2022, the Department received 886 disability-related complaints, up from the total of 474 filed during the first six months of 2021.
- Complaints About Discrimination: A total of 15 complaints alleging discrimination were received, which decreased from the 52 complaints which were received in May 2022 — but increased from the ten complaints recorded in June 2019:
- Nine complaints regarding race
- Three complaints regarding color
- One complaint regarding national origin
- One complaint regarding religion
- One complaint regarding sexual discrimination
For the first six months of 2022, a total of 102 discrimination complaints were received, which increased from the total of 59 filed during the first six months of 2021:
- 43 complaints regarding religion
- 41 complaints regarding race
- Seven complaints regarding color
- Six complaints regarding national origin
- Two complaints regarding ancestry or ethnicity
- Two complaints regarding sexual discrimination
- One complaint categorized as “other”
Final Boarding Call

The Air Travel Consumer Report is designed to assist consumers with information on the quality of services provided by airlines, as the Office of Aviation Consumer Protection of the Department of Transportation of the United States continues to monitor the operations of airlines to ensure that airlines are not engaging in unrealistic scheduling of flights and are complying with aviation consumer protection requirements — including ensuring consumers receive prompt refunds if they are no longer interested in continuing their travel when their flights are cancelled or significantly changed.
As the data from the Air Travel Consumer Report, consumer complaints, and other information which is secured from the airlines to inform its enforcement activities and the adequacy of existing rules, the Department of Transportation encourages consumers to file air travel consumer or civil rights complaints online here or via voice mail at 202-366-2220, or you may send a complaint via postal mail to:
Aviation Consumer Protection Division
U.S. Department of Transportation
C-75, W96-432
1200 New Jersey Avenue, SE
Washington, DC 20590
Considering the chaotic summer of travel in 2022 in which prices had significantly increased while service and product quality was simultaneously markedly poorer, I am surprised that the percentage of complaints is not greater than 270 percent…
All photographs ©2007, ©2015, ©2017, and ©2018 by Brian Cohen.
